
As a dentist, it’s important to understand what is and isn’t working when it comes to your dental practice marketing. Knowing this type of data helps you continually make improvements and learn more about your target audience.
Google Analytics (GA) is a FREE online tool that’s easy to install on your website (especially if you’re a ProSites member) and provides quality data needed to evaluate marketing activities. Use the guide below to see all the things you can do once you install Google Analytics on your dental website.
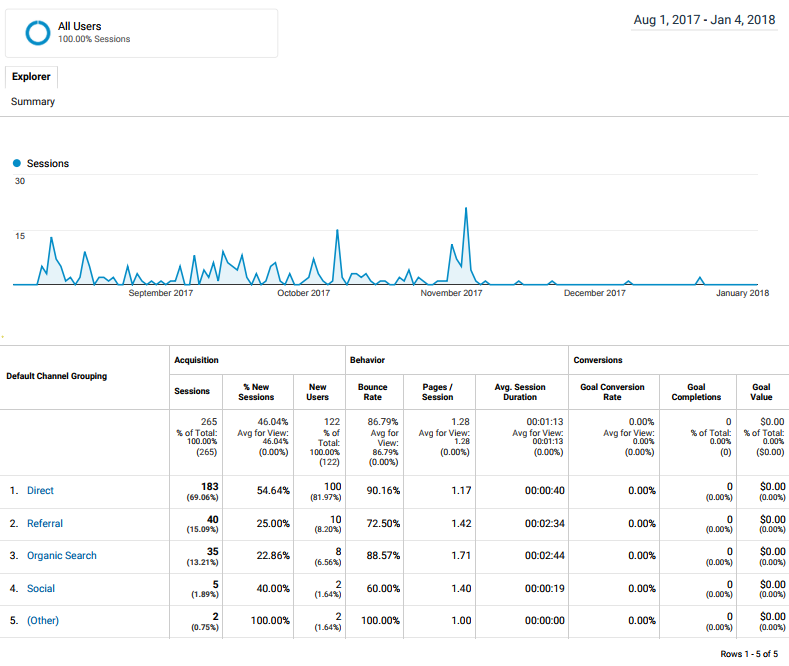
- Segment website traffic by acquisition channels to learn which type of traffic is most valuable to your practice. You can use GA to find out how people arrive on your website in one of five ways: direct, referral, social, organic and paid search.
- Direct: the number of visitors who entered your website URL directly into the browser
- Referral: visits initiated from another website outside of search engines or social media sites (e.g. if your website is listed on the local chamber of commerce website)
- Social: visitors who came to your website directly from social media sites (e.g. Facebook or Twitter)
- Organic: visitors who came to your website from search engine results like Google or Yahoo
- Paid: visitors who came to your website from PPC campaigns (e.g. Google AdWords)
Learning how people get to your website is key and provides insights into which types of campaigns are driving the most traffic to your website. For example, if you’re spending a lot on social media marketing but aren’t seeing any social traffic, it may be a sign that you need to update your strategy. Similarly, if paid traffic is up, but organic traffic is down, it may be wise to consider search engine optimization (SEO) for better rankings.
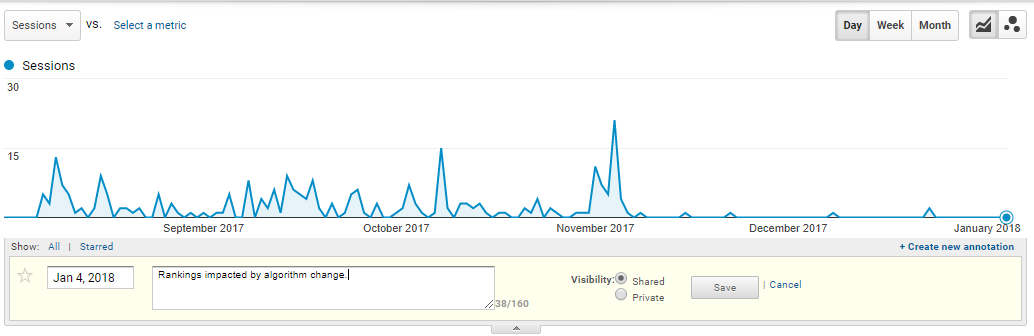
- Understand and document fluctuations in website traffic with annotations. Over time, you’ll likely notice changes in your website traffic patterns. This could be due to intentional changes, like getting a new website design or investing in SEO, or something less obvious, like Google changing an algorithm that greatly impacts your rankings and organic traffic.
As you make changes to your website, online marketing strategy, or learn about new Google updates, use annotations to note these updates. This way, when you go back to analyze your traffic, you can better pinpoint reasons for the fluctuations.
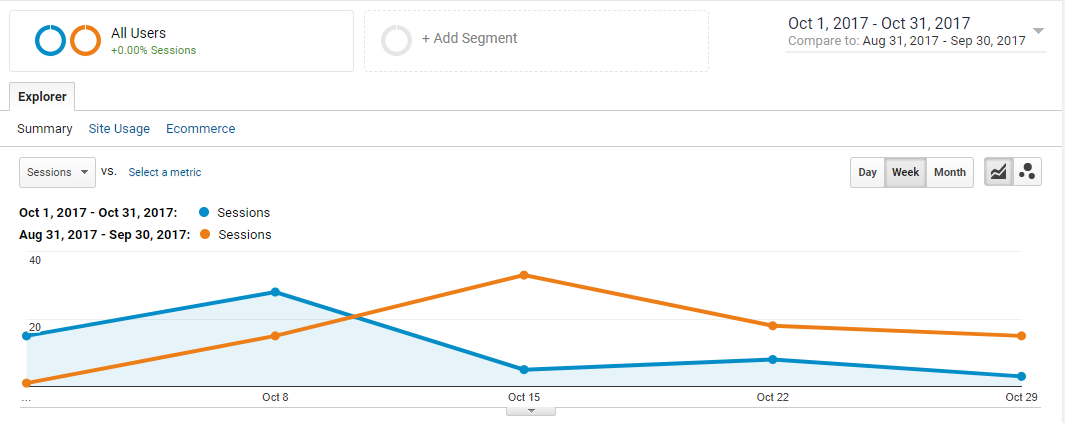
- Identify “normal” traffic patterns by comparing date ranges. As traffic fluctuates, you can identify what is “normal” by comparing traffic over periods of time.
For example, if your website averages 100 sessions per month in Q4 of any given year, but this year you saw 50 sessions a month in the same time period, this abnormality may be a clue that something caused a change. Alternatively, if your website saw 200 sessions per month after a year of consistent marketing activities, it’s an indication that those activities are working in your favor.
- Use goals to understand if visitors are taking a desired action on your website. The purpose of most websites is to gain business and initiate contact from visitors. Creating goals in GA helps you understand if visitors are taking desired actions on your website, such as filling out a form for more information. Once you set-up a goal (e.g. completing a form) and a visitor takes this action, GA will trigger a goal completion which can be interpreted as a lead.
This data is helpful in understanding how effective your website is at converting visitors to new patients. You’ll learn how many times a form is completed and the percentage of traffic that takes action on your site, all while segmenting these actions by acquisition channel. A low percentage of people acting on your website may signal the need for more calls-to-action, additional content, or different offers.
- Access data easily and regularly by creating reports to reference and monitor your overall performance.
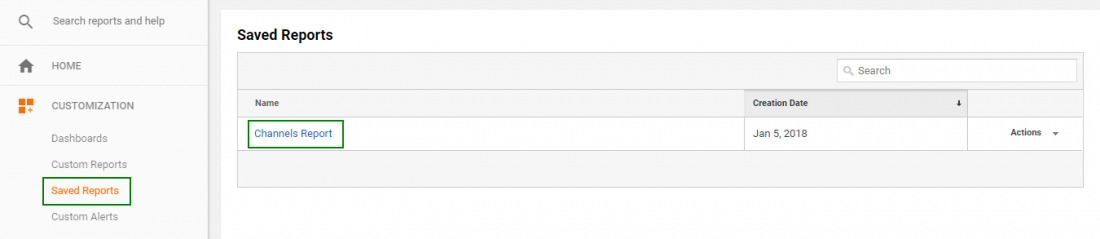
For example, say you want to compare traffic at the end of each month to the previous month to understand how recent traffic is trending. To create the report, select the date range you wish to analyze (current month), and then select previous period. Once you get the view you wished to see, hit save (on the tool bar) and name the report.
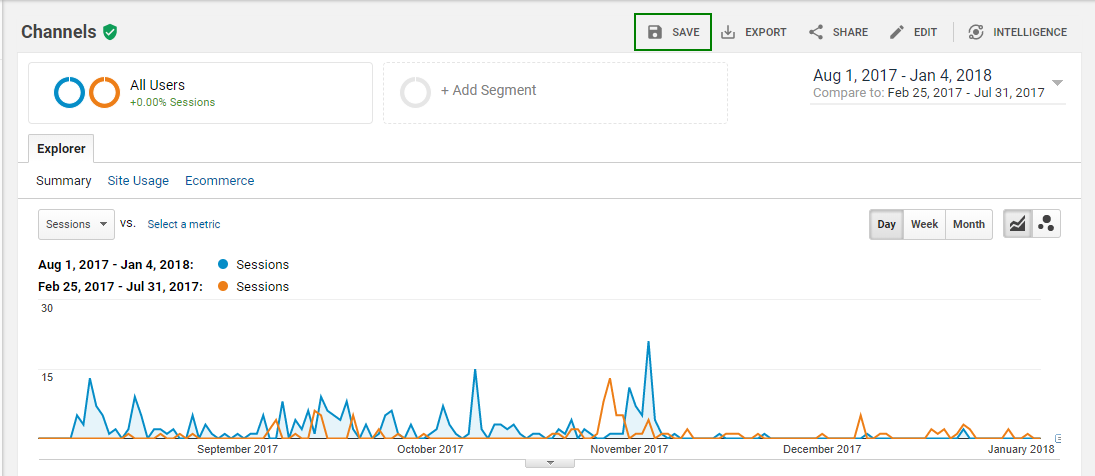
You will then be able to find the saved report under customization in the left hand column.
Implementing GA into your marketing toolkit is a must, as these detailed analytics will help you understand your accountant marketing ROI. As you learn more about your website and its performance, you can make smarter, more informed decisions about your practice’s overall marketing strategy and priorities.
For more information on accountant marketing, download the free guide, How to Increase Retention and Lifetime Value of Patients, by filling out the form below.
Can’t view form? Click here.


